

Tear Sheet
The Tear Sheet tab is a strategy-vs-benchmark report you can review in the app.
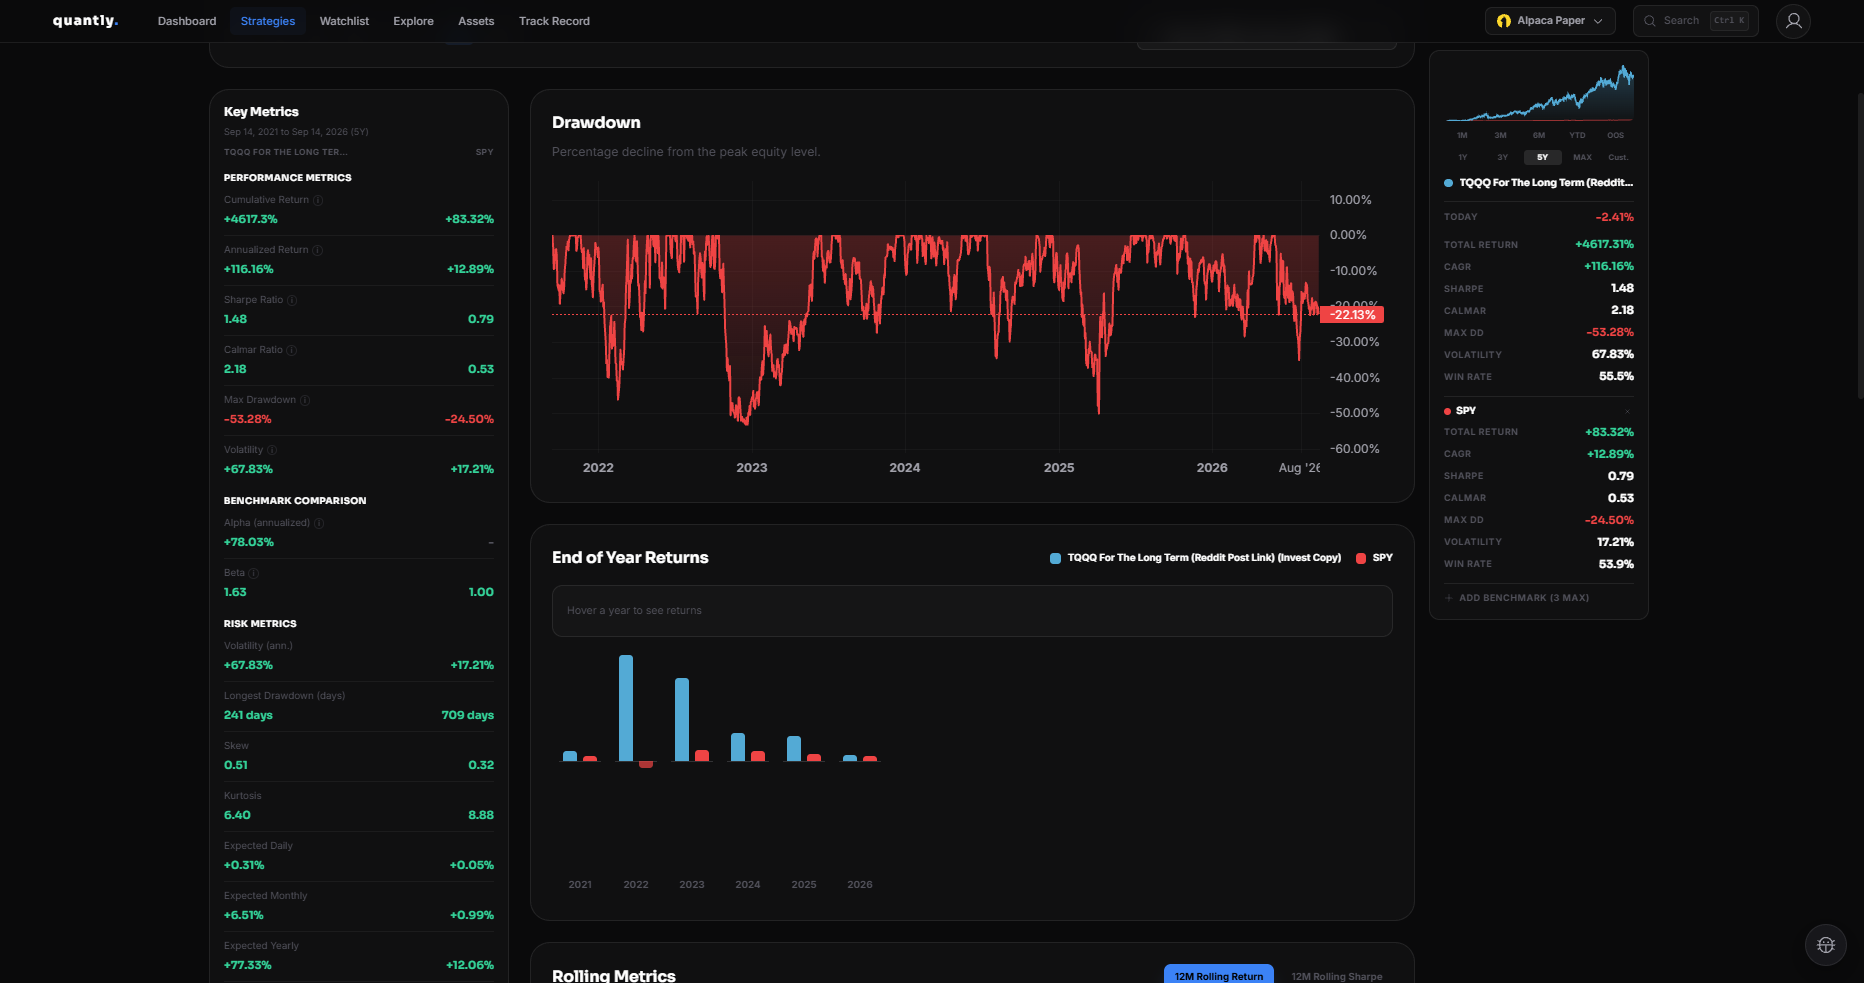
What’s included
Section titled “What’s included”| Section | Description |
|---|---|
| Key Metrics sidebar | Seven grouped stat sections comparing strategy vs benchmark |
| Drawdown | Underwater plot of peak-to-trough declines |
| End of Year Returns | Year-by-year return bars for strategy and benchmark |
| Rolling Metrics | 12-month rolling return or rolling Sharpe |
| Returns Distribution | Histogram of daily, weekly, or monthly returns |
| Monthly Returns Heatmap | Color-coded grid of strategy returns by month and year |
| Worst 10 Drawdowns | Table of the deepest drawdown episodes by max decline |
Controls
Section titled “Controls”- Benchmark - choose from the benchmarks already configured on the Performance tab
- Date range - presets (
1M,3M,6M,YTD,1Y,3Y,5Y,MAX) or a custom range - Export PNG - download or copy the current tear sheet view as an image
Shareable URL query params are also supported: ?tab=tearsheet, ?range=1Y, ?start=2020-01-01, ?end=2024-06-01, and combinations of start/end.
Key metrics sidebar
Section titled “Key metrics sidebar”The scrollable sidebar groups comparison stats into seven sections:
- Performance Metrics - cumulative return, annualized return, Sharpe, Calmar, max drawdown, standard deviation
- Benchmark Comparison - alpha, beta
- Risk Metrics - volatility, longest drawdown, skew, kurtosis, expected returns, Kelly, risk of ruin, VaR, expected shortfall
- Ratio Metrics - Sortino, smart Sharpe/Sortino, gain/pain, payoff, profit factor, tail ratio, and related ratios
- Win/Loss Metrics - win rates by day/month/quarter/year, consecutive streaks, average up/down months
- Drawdown Metrics - recovery factor, ulcer index, serenity index
- Best/Worst Periods - best and worst day/month/year, average drawdown depth and duration
Advanced ratios follow standard quantitative analytics definitions (aligned with common tear sheet libraries). Hover the info icon next to a metric for a short description.
Add at least one benchmark on the Performance tab before opening the tear sheet.
Next step
Section titled “Next step”Ready to deploy? See Invest and Deploy.