

Backtesting
Backtesting simulates your strategy against historical data so you can evaluate performance before deploying capital.
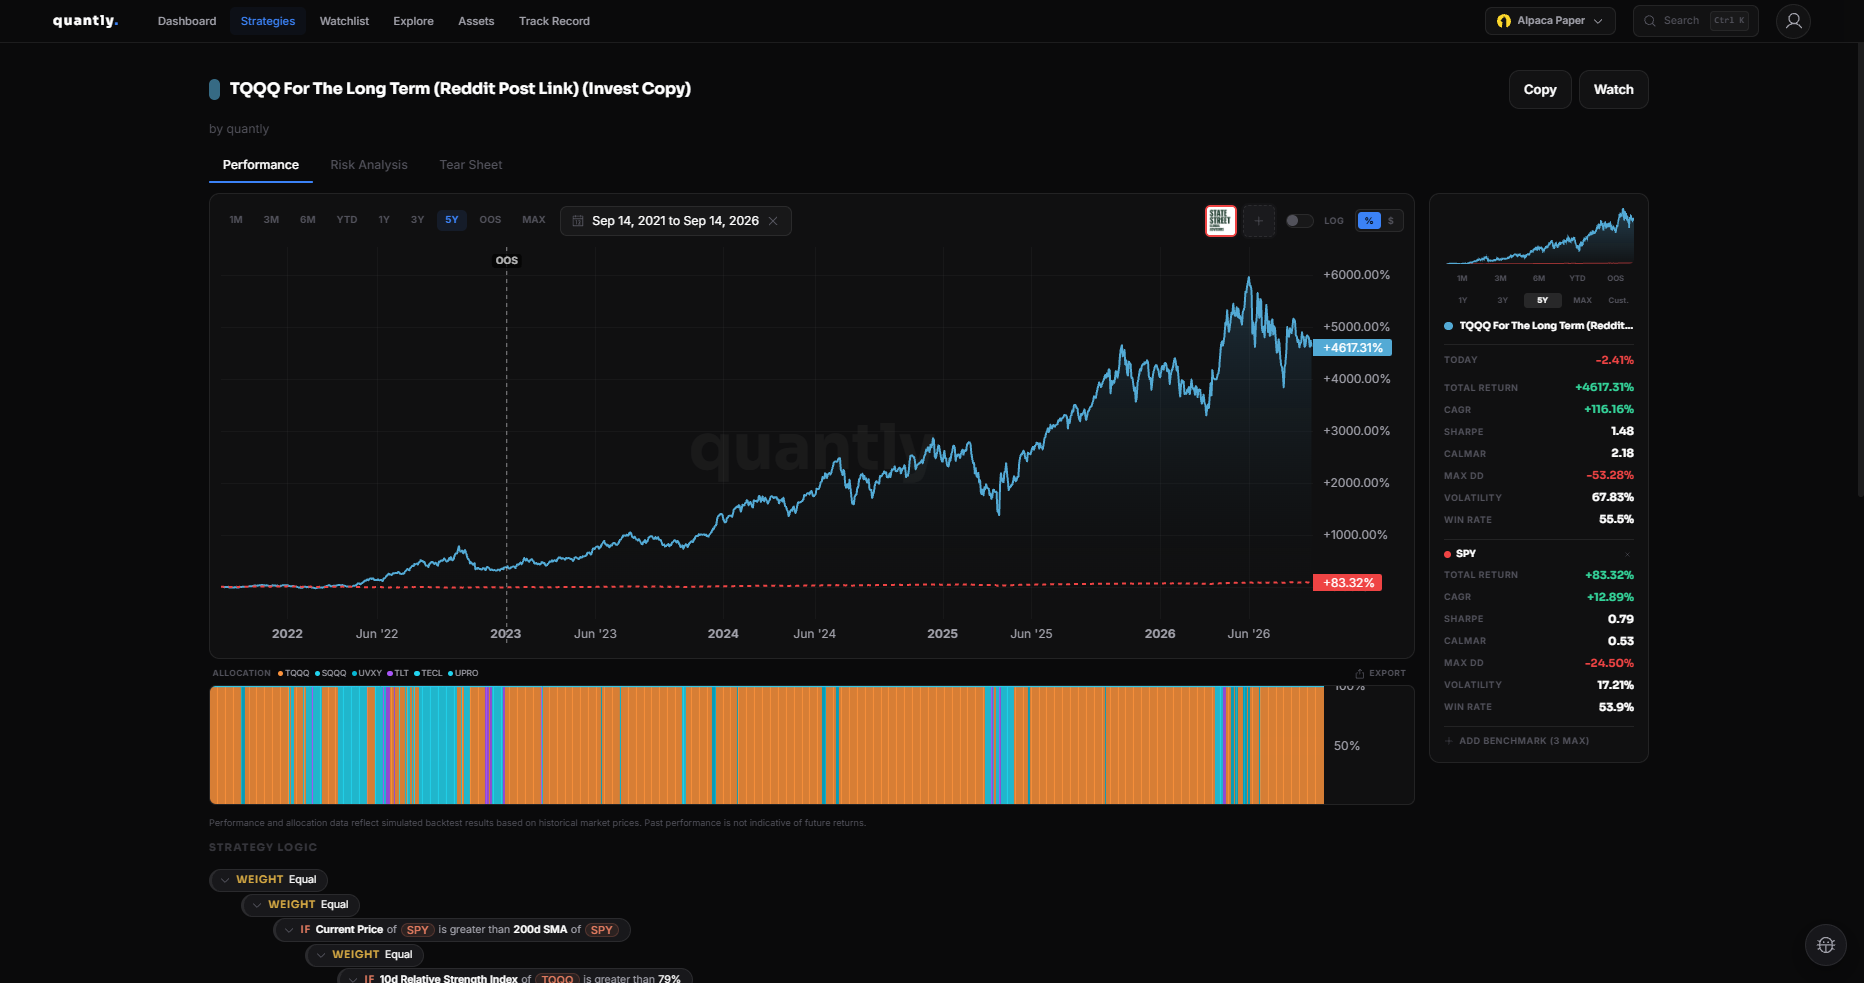
Running a backtest
Section titled “Running a backtest”Open your strategy in the editor.
Go to the Performance tab.
Select a date range: 1M, 3M, 6M, YTD, 1Y, or MAX.
Review the equity curve, metrics, and benchmark comparison (for example vs SPY).
Key metrics
Section titled “Key metrics”| Metric | What it tells you |
|---|---|
| CAGR | Annualized growth rate over the period |
| Sharpe | Return per unit of risk (higher is better) |
| Max DD | Largest peak-to-trough decline |
| Win Rate | Share of profitable trades |
| Total Return | Overall percentage gain or loss |
See Metrics Glossary for full definitions.
Equity curve
Section titled “Equity curve”The chart plots strategy equity over time. A benchmark line (such as SPY) helps you see if the strategy outperformed the market.
Hover over the chart to see exact values at any date.
Branch history
Section titled “Branch history”When you change strategy logic, Quantly tracks branch history - versions of your tree over time. You can compare how edits affected performance.
Limitations
Section titled “Limitations”Backtesting is a simulation. Keep in mind:
- Slippage - real fills may differ from historical prices
- Survivorship bias - delisted assets may not appear in history
- Overfitting - tuning to past data may not work forward
Past performance does not guarantee future results.
Next steps
Section titled “Next steps”- Assess robustness in Risk Analysis
- Dive into Tear Sheet
- Deploy with Invest and Deploy