

Risk Analysis
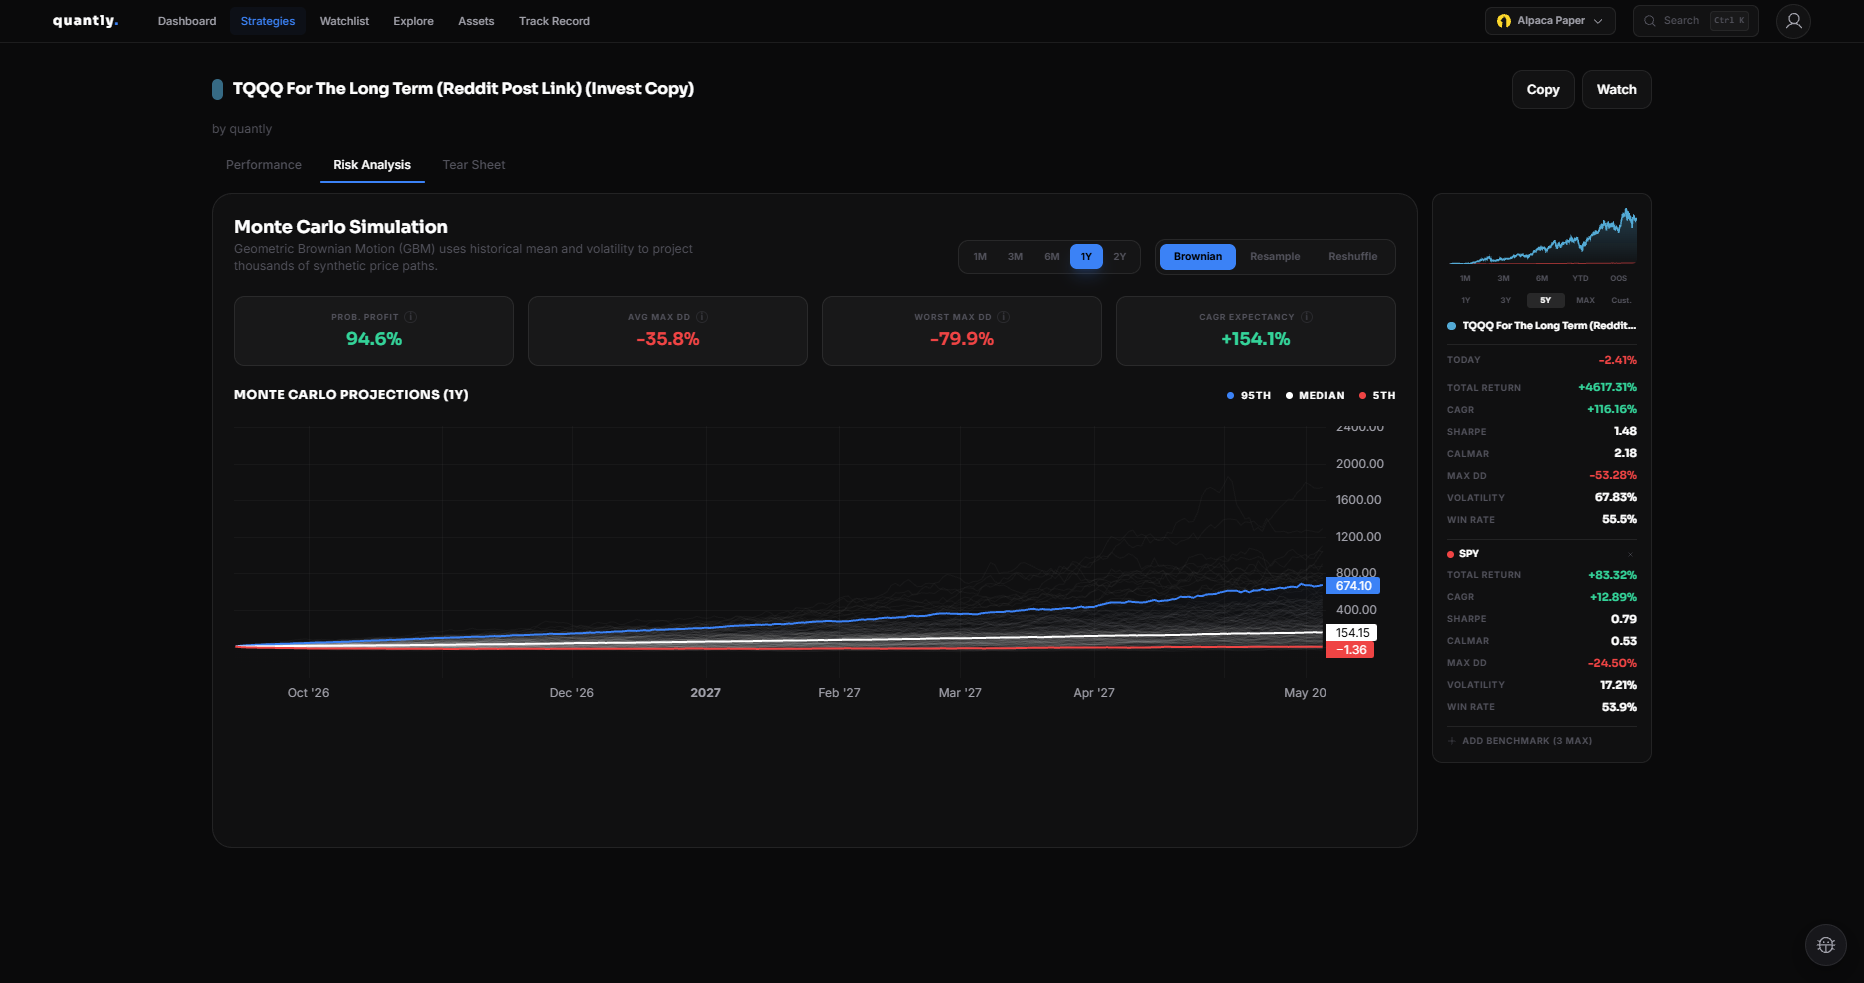
The Risk Analysis tab uses Monte Carlo simulation to show how your strategy might perform under varied conditions.
What Monte Carlo shows
Section titled “What Monte Carlo shows”Monte Carlo runs many simulated variations of your strategy’s trade sequence. Results appear as:
- A confidence band around expected returns
- Distribution of outcomes across simulations
- Whether performance holds up under perturbation
If the strategy consistently performs across simulations, it may be more robust than one that only works on the exact historical path.
How to use it
Section titled “How to use it”1
Open your strategy and go to the Risk Analysis tab.
2
Review the simulation chart and summary statistics.
3
Compare bands at different confidence levels if available.
What to look for
Section titled “What to look for”| Signal | Interpretation |
|---|---|
| Narrow band, stable median | More consistent simulated outcomes |
| Wide band, skewed distribution | Higher uncertainty |
| Median below benchmark | Strategy may underperform in many scenarios |
Not a guarantee
Section titled “Not a guarantee”Monte Carlo explores variation around historical trades. It does not predict black swan events or structural market changes.
Next step
Section titled “Next step”See Tear Sheet for monthly returns, drawdown, and benchmark comparison detail.