

Dashboard
The dashboard is your command center for portfolio performance and strategy activity.
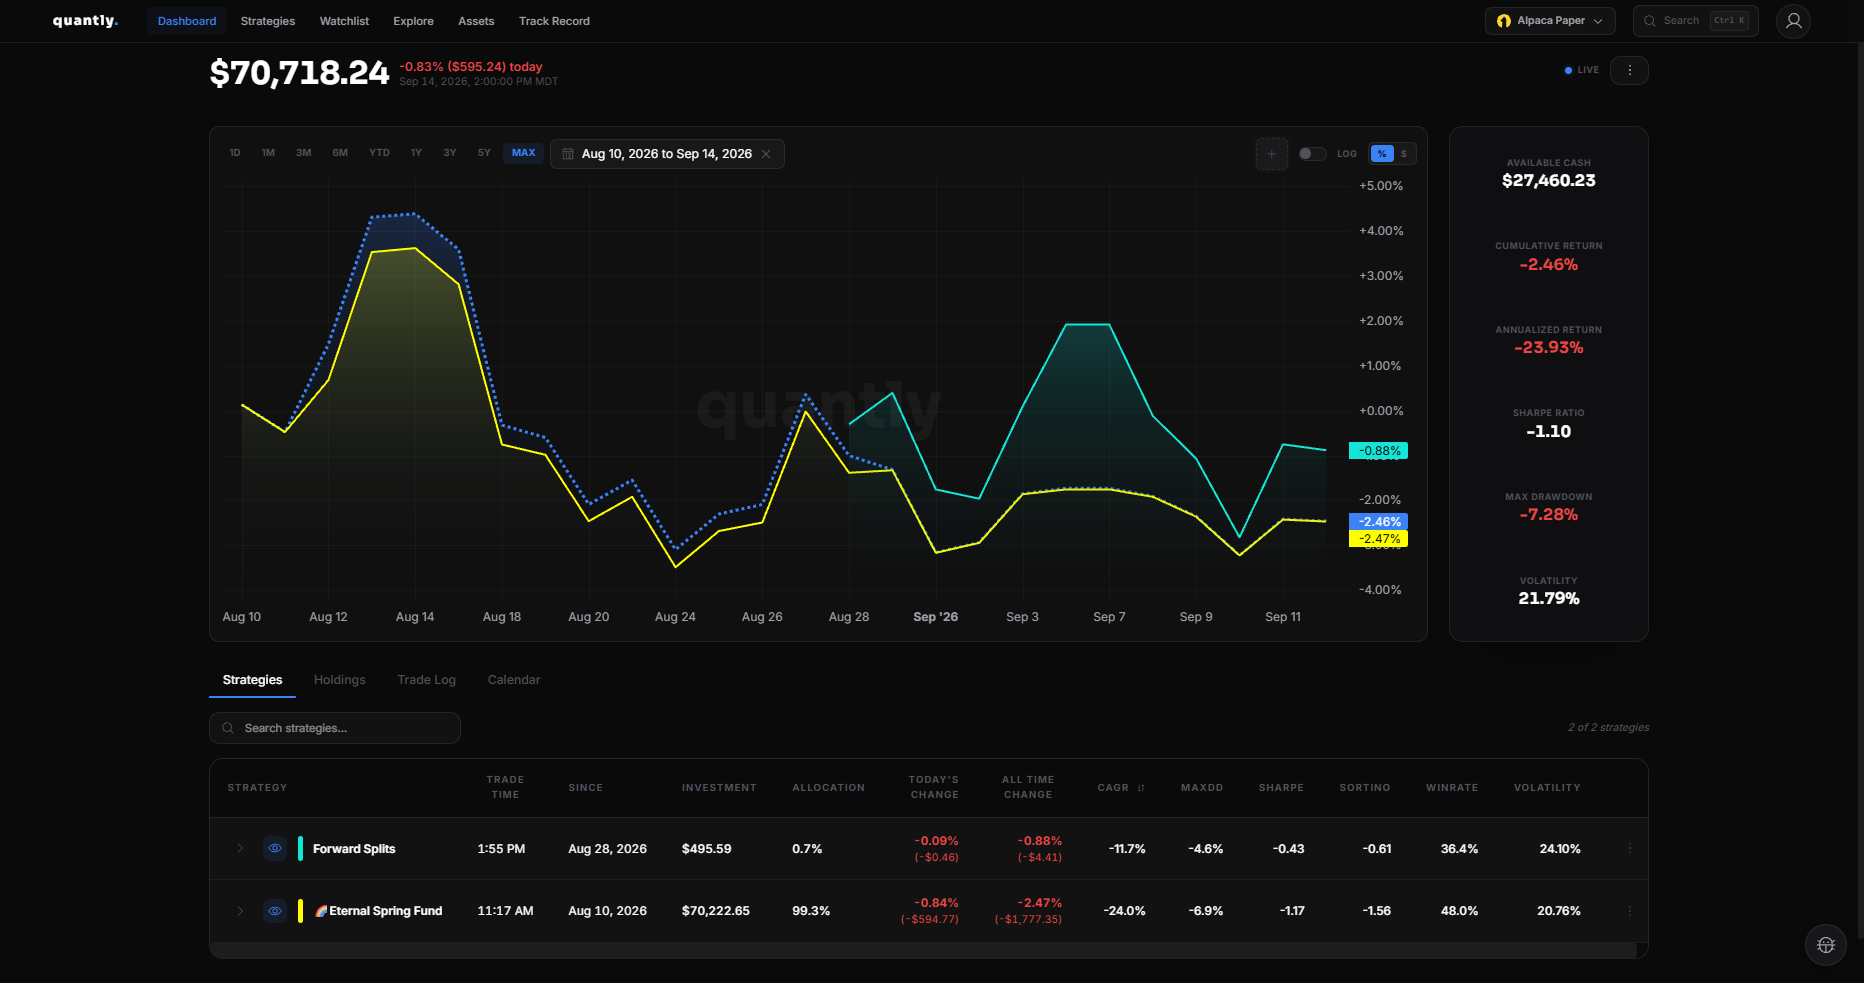
Overview
Section titled “Overview”Open Dashboard to see:
- Portfolio value and today’s change in the header
- Equity curve with optional benchmark overlay
- Portfolio stats panel (cash and risk metrics)
- Tabs for Strategies, Holdings, Trade Log, and Calendar
Portfolio metrics
Section titled “Portfolio metrics”Header
Section titled “Header”| Metric | Description |
|---|---|
| Portfolio value | Managed portfolio equity (sum of invested strategy value) |
| Today’s change | Session-based P&L in dollars and percent (resets at market open ET) |
Stats panel
Section titled “Stats panel”Beside the equity chart, the stats panel shows:
| Metric | Description |
|---|---|
| Available cash | Brokerage cash available for new strategy investments |
| Cumulative return | Total return over the selected chart range |
| Annualized return | Return normalized to a yearly rate |
| Sharpe ratio | Risk-adjusted return |
| Max drawdown | Largest peak-to-trough decline |
| Standard deviation | Portfolio volatility |
Quantly tracks managed capital only - capital you allocated through the platform. Manual positions outside Quantly are not included.
Equity chart
Section titled “Equity chart”- Line chart of portfolio value over time
- Benchmark comparison (for example SPY)
- Range selector: 1M, 3M, 6M, YTD, 1Y, MAX
Strategies tab
Section titled “Strategies tab”The Strategies tab lists each invested strategy in a table with:
- Current value and allocation share of the portfolio
- Today’s change and cumulative return
- Invested since date
- Actions: manage capital, dry run, trade now, go to cash, and more
A filter shows how many strategies match your search (for example, “3 of 5 strategies”). That is not a separate top-level metric.
Click a strategy name to open it in the editor.
| Tab | Content |
|---|---|
| Strategies | Your invested strategies at a glance |
| Holdings | Current positions across strategies |
| Trade Log | Executed trades and activity |
| Calendar | Daily P&L heatmap by strategy |
See Holdings and Trade Log for Holdings and Trade Log details.
Calendar tab
Section titled “Calendar tab”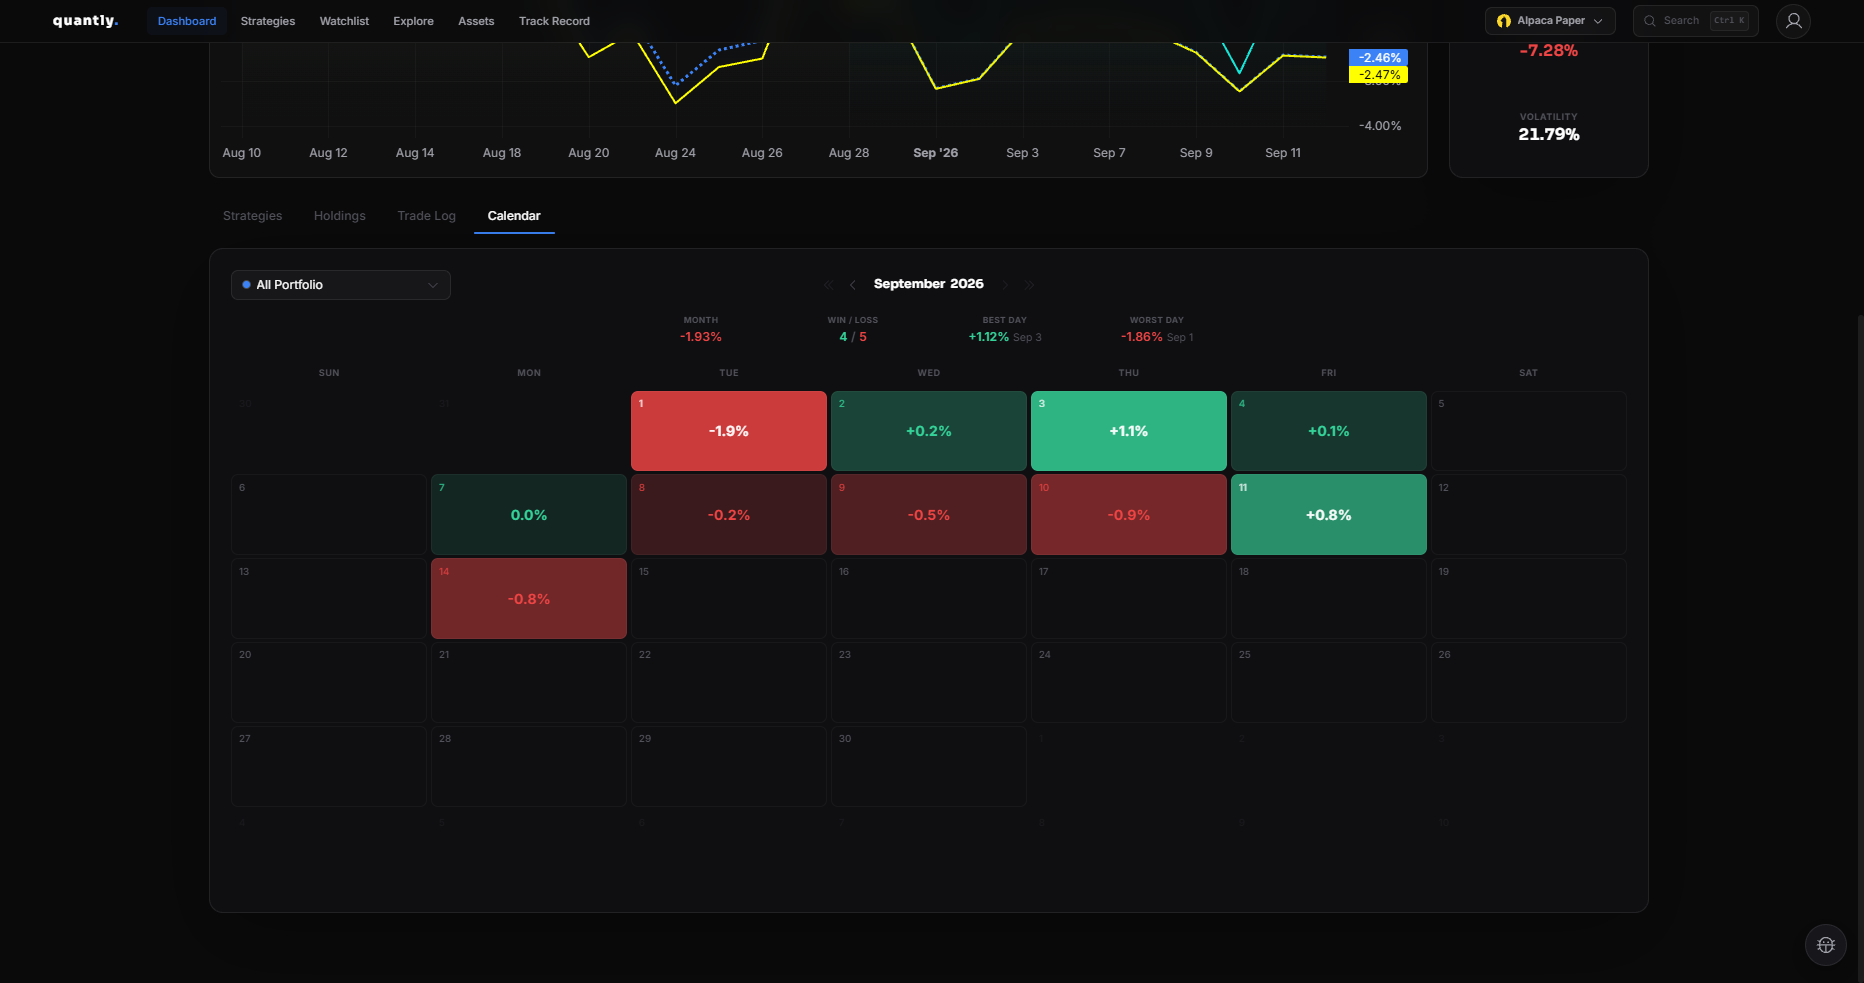
The Calendar tab visualizes day-by-day portfolio performance so you can spot winning and losing sessions at a glance.
Next steps
Section titled “Next steps”- Performance Metrics - how returns are calculated
- Invest and Deploy - add capital to strategies